
वैश्विक उपयोगकर्ताओं के साथ व्यापार करना सीखें!

जल्दी से अपने पेशेवर कौशल को बढ़ाएं

अपने निवेश को अगले स्तर पर करें

Webinars
Join sessions for all levels stay updated on market trends.

Seminars
Attend seminars to get expert analysis and valuable strategies.

Trading tutorials
Learn the fundamentals and how-to guides to excel in trading.

Trader’s blog
Get tips and ideas for a well-balanced trading experience.
How to Harness the Dragon Pattern: The Key to Forex Success
The Dragon Pattern is one of the most potent formations in CFD trading, offering traders a precise blueprint for identifying

Trading in Times of War & Peace: How Geopolitical Conflict Shapes the Markets
In 2025, as global conflicts like the Russia-Ukraine war, the war in Gaza, and Pakistan-India tensions send shockwaves through economies,
10 Habits of Successful Forex Traders
Did you know that more than 80% of retail forex traders struggle to maintain a winning track record? Yet, the
What Do Trump’s Energy Policies Mean for Oil Traders?
During the 2024 presidential campaign, Donald Trump made a striking promise: to cut energy prices in half within 12 months
How to Trade the EUR/USD Based on Inflation Fundamentals
Inflation is the silent force that shapes economies, moves markets, and influences the value of currencies. For traders navigating the

Trump’s Secret Tariff Agenda and How to Trade During Economic Downturns
The global economy is no stranger to turbulence, but few events have shaken markets as profoundly as President Donald Trump’s
How to Trade with MetaTrader 5?
In forex, Most of the forex traders consider metatrata five as their first choice as it’s easy to use. And it also offers an assortment of addons to enhance the trading experience, Metatrader five provides an array of opportunities for a pool of actions in the financial markets such as trading, analysis, testing of trading strategies, the development and introduction of trading robots, and development of personalized technical indicators and scripts. This versatility was designed to equip the user with a complete set of tools so that traders can trade in any financial market with ease, this post mainly deals with the user guide of Metatrader five and can be considered as a Metatrader five manual. What is Metatrader five? Metatrader five isn’t just a trading platform, it’s a complete and highly preferred trading platform in most financial markets around the world. It’s highly accessible interface, rich functionality and straightforward and intuitive logic of trade Metatrader five works on all forex and stock markets who want to have access to a broader range of trading opportunities. Charts, indicators, technical analysis of quotes get all the latest news and developments from all the key financial markets and algorithm trading. After that, he or she has to execute the setup file Mt five setup exe and then has to follow instructions as they appear on the screen. After completing the installation, anyone can easily start using Metatrader five through a shortcut on the desktop one. Press the link for download of the online trading platform Metatrader five from the web page of eurofinance and press Next two. Choose the directory on your computer in which you want to install the trading platform Metatrader five and press next to start the installation. Three press finish to complete the installation and start the trading platform. Metatrader five, as it’s already mentioned, that metatrata four is very popular among traders because of the advanced features and latest technology. There is one more feature which attracts traders and that is demo account trading. How to open the first demo account? Well, the first and best choice would be to contact your personal account manager and ask for it. They will be happy to do it for you and take care of everything. But if you’re determined to do it yourself, the Metatrader five manual contains certain steps which a trader has to follow for opening a demo account. First of all, one has to open Metatrader five, then select a server. After that, the trader can specify details of an existing trade account or create a new one. The next stage of opening an account is specifying personal details where the trader will be given a registration form to fill out to prevent providing of incorrect information about the person who opens an account. Each email address is confirmed once during the next registration of an account using the same email, the confirmation stage will be skipped. The trader will then have registrations set up just after the completion of the registration page. Login details will be shared automatically on the screen. One can also repeat the same process for a number of demo accounts that he or she wants to open Metatrader five trading indicators. A technical indicator is the most important tool when it comes to technical analysis. Technical indicators are used to automatically identify various patterns in the price dynamics of currencies, shares, and other forms of financial instruments. This information makes it easy for traders and brokers alike to make assumptions about the future price movements and accordingly adjust trading strategies. There are plenty of technical indicators, but the most famous and popular among them are included in Metatrader five. Any trader can use any of these technical indicators in his trading processes and strategies. Most technical indicators come with a plethora of settings that enable traders to adjust the various instruments for specific tasks. The appearance of the indicators can be controlled by both the analytical parameters and settings. For instance, the period of the moving average can be changed as well as the thickness, color, and line types of the terminal indicators can be positioned either on the price chart or in the special panes alongside its scale values. This makes it possible to apply some other indicators. The Metatrader five offers traders a powerful and useful tool for high grade intelligence metatrata five Strategy Tester traders can check the quality of the written algorithm by using the strategy tester built in Metatrader five. This fantastic tool allows you to determine the efficiency and choose the best input parameters before running an advisor In trading Metatrader five Strategy Tester gives traders multiple testing modes, enabling you to select the optimum ratio of speed to quality test to fulfill the requirements of traders. One significant advantage of the Metatrader five strategy tester is the illustration of trade advisors test results. You can see how much the algorithm earned during the testing phase. It also shows a broad range of statistical information, such as the number of successful and unsuccessful transactions, the profit and loss percentage, the risk factors, and much more alerts in Metatrader five when it comes to sending in notifications about the important events regarding trading, Few tools are as fast and efficient as the alerts in Metatrader five, The binary options trading strategy can be designed to be more mobile and flexible.
How to identify the Market direction Pt.2
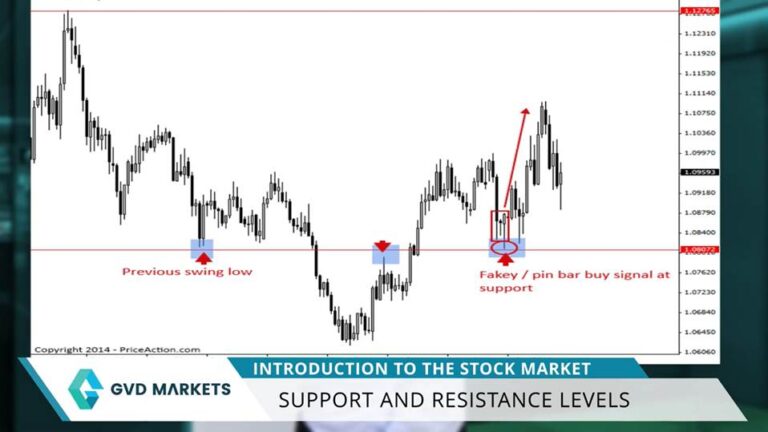
Technical Analysis We last parted with this image, so market trends are made of swing highs and swing lows or waves. Now wave is a very natural part of the market like we’ve seen before. Markets will generally move up and down in a gradual fashion over long periods of time when the market is in a downtrend, we get lower swing lows and lower swing hot. Now it’s easy to see on this chart that every swing low was lower than the previous one, and every swing high was lower than the previous one as well. Likewise, an uptrend has higher swing highs and higher swing lows, so a set of lower swing highs or lows every time means the market is in a downtrend instead of higher swing highs or lows means the market is in an uptrend. Words may confuse you, but if you look at a chart, things get much simpler. Now the question remains, how do we know that the market is changing direction? There are two things you should look at when the stock is in an uptrend and it breaks the previous swing low. The uptrend is now in question. When this happens, we’re looking to see whether this fall continues or not. We need one more thing. If the market makes a lower swing high and continues downwards, we have the characteristics of a downtrend with an uptrend. This means almost certainly that the uptrend is now over and the market will now either go sideways or in a full blown downtrend. It works the same with a downtrend when a previous swing high breaks and we get a higher swing low, the market continues upwards. We can safely assume the downtrend is over and a new uptrend has begun. Now, these are general principles you can use for all markets. Just make sure they’re not spiky or can not be read or have no volume. These will work great on Nasdaq charts. Let’s see the other side of things. Fundamental Analysis Now, fundamental analysis before we get into why some investors closely track a stock’s likely direction. Let’s look at a few indicators that help them with the task. While the financial markets have clearly stated business hours, developments outside of those hours continue to influence both the value of securities and investor behaviour, geopolitical events and natural disasters, for example, can occur at any time. Events like the assassination of a sitting president or a major terrorist attack are likely to indicate a lower market. Open corporate data also plays a role. Earnings announcements made after the close or before the open can influence the market’s direction In January April July and October, the vast majority of firms released their results for the quarter. Good news from a bellwether firm often leads to a higher stock market. Open bad news can have the reverse effect. Other important news comes out before the markets open. A wide variety of economic releases, including employment data, retail sales, and gross domestic product results, are released at eight 30 AM. Once again, both good news and bad news can sway the market. Open direction trading activity is also a common indicator. Extended hours trading takes place after the financial markets close for the day and before they open, this activity can help investors predict the open market direction. In fact, gauges such as the Nasdaq 100 premarket indicator SM, are designed specifically for this purpose. The Nasdaq 100 after hours indicator SM is a similar gauge. International Market Influence When domestic markets are closed for the day, international markets are open and trading a good day in Asian markets can suggest the us markets will open higher. Devastating losses overseas can lead to a lower open at home by paying attention to developments overseas, Domestic investors can get an idea about what direction they expect local markets to move when they open for the day. Major stock exchanges in Tokyo, Germany and London are often used as barometers for what will happen in the us. The futures market is yet another barometer used to predict the direction financial markets will move. Unlike the stock market futures markets never close. Futures contracts trade based on the values of the stock market benchmark indexes. They represent SP 500 futures trade based on the value of the standard Pause 500 just as the Dow futures trade based on the value of the Dow Jones Industrial average. Since the securities in each of the benchmark indexes represent a specific market segment, knowing the direction of pricing on futures contracts for those indexes can be used to project the direction of prices on the actual securities and the markets in which they trade. If SP futures are trending downward all morning, it’s likely that stock prices in the us exchanges will move lower when trading opens for the day. Once again, the opposite is also true, with rising futures prices suggesting a higher open, serious market watchers wake up early, pull the data and use these various indicators singly and in combination to discern the direction of the opening moves. In the us market, less ambitious investors just tune into the morning financial news broadcasts and let the talking heads provide an update on expectations for the day. Either way, it is possible to get a fairly solid reading on what to expect when us trading starts for the day.
How To Identify The Market Direction?
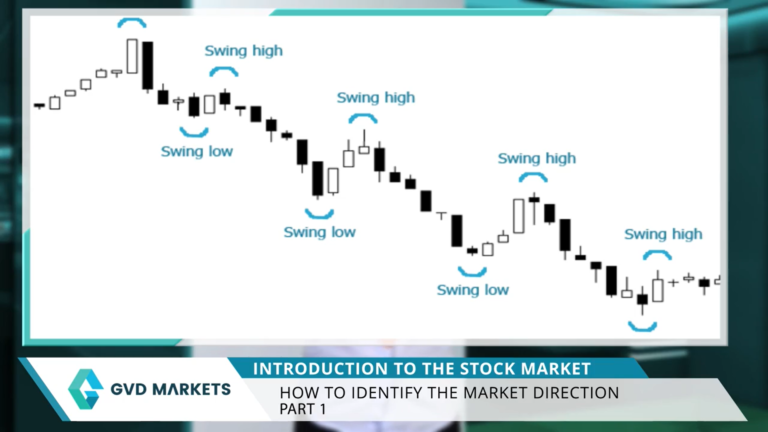
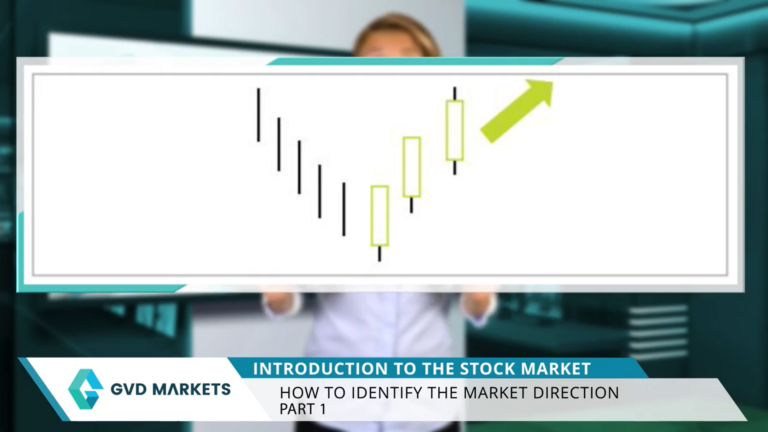
How to identify the market direction? The theory today we’re going to learn about market direction. It’s very interesting because everyone keeps coming up with the question, will the market rise or fall using just a few technical tools, not indicators, just pure price action? We can actually determine market direction. Market direction is actually referred to in the technical world as trends. A stock moving upwards is in an uptrend. A stock moving downwards is in a downtrend. Sometimes stocks reach a no trade zone or a sideway zone. This happens because when markets go up, it forces a situation of supply. And when markets fall down, it forces a situation of demand. When we use the concepts of supply and demand over very long periods of time. You must realize that psychology exists on all time frames, except of course, in tick charts where you have volume, markets will always move the same way. If your concept is technically sound, let’s see how you can become your own amateur financial analyst, Determining whether the stock you’re stuck in or making a profit with might continue to go up or continue to move down. The first thing we’re going to learn is rally and decline. Rallies and declines are seen on a per bar basis, meaning we look only at one bar and the next. Simply put, a rally is in an upwards move, and a decline is a downwards move. Let’s look at a decline first. In the left part, notice how the next bar always breaks the previous bars low. It also has a lower high. This means the market is in decline mode. Remember that in real market situations it may not happen consecutively, but a general move down is still considered a decline. A rally is just the opposite. Look at the right part of the chart. The market going up has every consecutive bar. Bri, the previous bars high. It also has a higher low, The market is in rally mode. If the market then goes into decline, mode, then afterwards back to rally mode, the chart will have the shape of a wave. Markets will always move in waves. They’ll never plunge down or soar unless on erratic days over general long periods of time, markets will always move in waves. And this is very healthy. Now that we’ve understood a rally and a decline, let’s move on to swing highs and swing lows. Simply put, the meeting point of a rally and a consecutive decline Forming the shape of a tent is a swing high. The opposite, the meeting point of a decline and a consecutive rally is a swing low. Trends are made of swing highs and swing lows. People use different names to call them, but they all technically follow this because a swing high is a natural place of resistance. It basically means that the market rallied, hit a supply point, then either buying diminished or too much selling happened and it fell. The longer a swing high remains untouched, the stronger it gets. Here’s a real example of a chart. It’s basically a downtrend, but it’s full of swing highs and swing lows. We’ve marked both on the chart. You should learn how to recognize them. How do trade swings? Swing trading has been described as a kind of fundamental trading in which positions are held for longer than a single day. Most fundamentalists are actually swing traders, since changes in corporate fundamentals generally require several days or even a week to cause sufficient price movement to render a reasonable profit. But this description of swing trading is a simplification. In reality, swing trading sits in the middle of the continuum between day trading to trend trading. A day trader will hold a stock anywhere from a few seconds to a few hours, but never more than a day. A trend trader examines the longterm fundamental trends of a stock or index and may hold the stock for a few weeks or months. Swing traders hold a particular stock for a period of time, generally a few days to two or three weeks, which is between those extremes, and they will trade the stock on the basis of its intraweek or intramonth oscillations between optimism and pessimism. The right stockcks for swing Trading. The first key to successful swing trading is picking the right stocks. The best candidates are large cap stocks, which are among the most actively traded stocks on the major exchanges in an active market. These stocks will swing between broadly defined high and low extremes, and the swing trader will ride the wave in one direction for a couple of days or weeks, only to switch to the opposite side of the trade. The Right Market
Understanding Market Trends: Uptrends, Downtrends, and Sideways Zones
How to identify the market direction? The theory today we’re going to learn about market trend. It’s very interesting because everyone keeps coming up with the question, will the market rise or fall using just a few technical tools, not indicators, just pure price action? We can actually determine market direction. Market direction is actually referred to in the technical world as market trend. A stock moving upwards is in a market uptrend. A stock moving downwards is in a downtrend. Sometimes stocks reach a no trade zone or a sideway zone. This happens because when markets go up, it forces a situation of supply, and when markets fall down, it forces a situation of demand. When we use the concepts of supply and demand over very long periods of time. You must realize that psychology exists on all time frames, except of course, in tick charts where you have volume, markets will always move the same way. If your concept is technically sound. Let’s see how you can become your own amateur financial analyst. Determining whether the stock you’re stuck in or making a profit with might continue to go up or continue to move down, The first thing we’re going to learn is rally and decline. Rallies and declines are seen on a per bar basis, meaning we look only at one bar and the next. Simply put, a rally is in an upwards move, and a decline is a downwards move. Let’s look at a decline first. In the left part, notice how the next bar always breaks the previous bars low. It also has a lower high. This means the market is in decline mode. Remember that in real market situations it may not happen consecutively, but a general move down is still considered a decline. A rally is just the opposite. Look at the right part of the chart. The market going up has every consecutive bar brig, the previous bars high. It also has a higher low. The market is in rally mode if the market then goes into climb mode, then afterwards back to rally mode, The chart will have the shape of a wave. Marcu will always move in waves, they’ll never plunge down or soar unless on erratic days over general long periods of time, markets will always move in waves. And this is very healthy now that we’ve understood a rally and a decline. Swing Highs And Swing Lows Let’s move on to swing highs and swing lows. Simply put, the meeting point of a rally and a consecutive decline Forming the shape of a tent is a swing high. The opposite, the meeting point of a decline and a consecutive rally is a swing Low trends are made of swing highs and swing lows. People use different names to call them, but they all technically follow this because a swing high is a natural place of resistance. It basically means that the market rallied, hit a supply point, then either buying diminished or too much selling happened and it fell. The longer a swing high remains untouched, the stronger it gets. Here’s a real example of a chart. It’s basically a downtrend, but it’s full of swing highs and swing lows. We’ve marked both on the chart. You should learn how to recognize them. How do trade swings? Swing trading has been described as a kind of fundamental trading in which positions are held for longer than a single day. Most fundamentalists are actually swing traders, since changes in corporate fundamentals generally require several days or even a week to cause sufficient price movement to render a reasonable profit. But this description of swing trading is a simplification. In reality, swing trading sits in the middle of the continuum between day trading to trend trading. A day trader will hold a stock anywhere from a few seconds to a few hours, but never more than a day. A trend trader examines the longterm fundamental market trends of a stock or index and may hold the stock for a few weeks or months. Swing traders hold a particular stock for a period of time, generally a few days to two or three weeks, which is between those extremes, and they will trade the stock on the basis of its intraweek or intramonth oscillations between optimism and pessimism. The right socks for? Final thoughts
Intermediate introduction: Fundamental analysts and Technical analysis
There are two basic ways you can invest or trade in the stock market. The first way is called fundamental analysis. The biggest part of fundamental analysis involves delving into the financial statements, also known as quantitative analysis. This involves looking at revenue, expenses, assets, liabilities, and all the other financial aspects of a company. Fundamental analysts Fundamental analysts look at this information to gain insight on a company’s future performance. Here’s how the MSN and Carta Dictionary defines the terms quantitative, capable of being measured or expressed in numerical terms, qualitative related to or based on the quality or character of something, often as opposed to its size or quantity. In our context, quantitative fundamentals are numeric, measurable characteristics about a business. It’s easy to see how the biggest source of quantitative data is the financial statements. You can measure revenue, profit, assets, and more with great precision. Turning to qualitative fundamentals, these are the less tangible factors surrounding a business. Things such as the quality of a company’s board members and key executives, its brand name recognition, patents, or proprietary technology. Neither qualitative nor quantitative analysis is inherently better than the other. Instead, many analysts consider qualitative factors in conjunction with the hard quantitative factors. Take the cocacola company, for example, when examining its stock, an analyst might look at the stock’s annual dividend payout, earnings per share, pay earnings ratio, and many other quantitative factors. However, no analysis of cocacola would be complete without taking into account its brand recognition. Anybody can start a company that sells sugar and water, but few companies on Earth are recognized by billions of people. It’s tough to put your finger on exactly what the Coke brand is worth, but you can be sure that it’s an essential ingredient contributing to the company’s ongoing success. Technical
Forex chart Formation Patterns
Forex chart formation patterns are valuable because they provide visual cues about market sentiment and potential price behavior. By recognizing