
How to identify the market direction? The theory today we’re going to learn about market direction. It’s very interesting because everyone keeps coming up with the question, will the market rise or fall using just a few technical tools, not indicators, just pure price action?
We can actually determine market direction. Market direction is actually referred to in the technical world as trends. A stock moving upwards is in an uptrend. A stock moving downwards is in a downtrend. Sometimes stocks reach a no trade zone or a sideway zone. This happens because when markets go up, it forces a situation of supply.
And when markets fall down, it forces a situation of demand. When we use the concepts of supply and demand over very long periods of time. You must realize that psychology exists on all time frames, except of course, in tick charts where you have volume, markets will always move the same way.
If your concept is technically sound, let’s see how you can become your own amateur financial analyst, Determining whether the stock you’re stuck in or making a profit with might continue to go up or continue to move down. The first thing we’re going to learn is rally and decline. Rallies and declines are seen on a per bar basis, meaning we look only at one bar and the next.
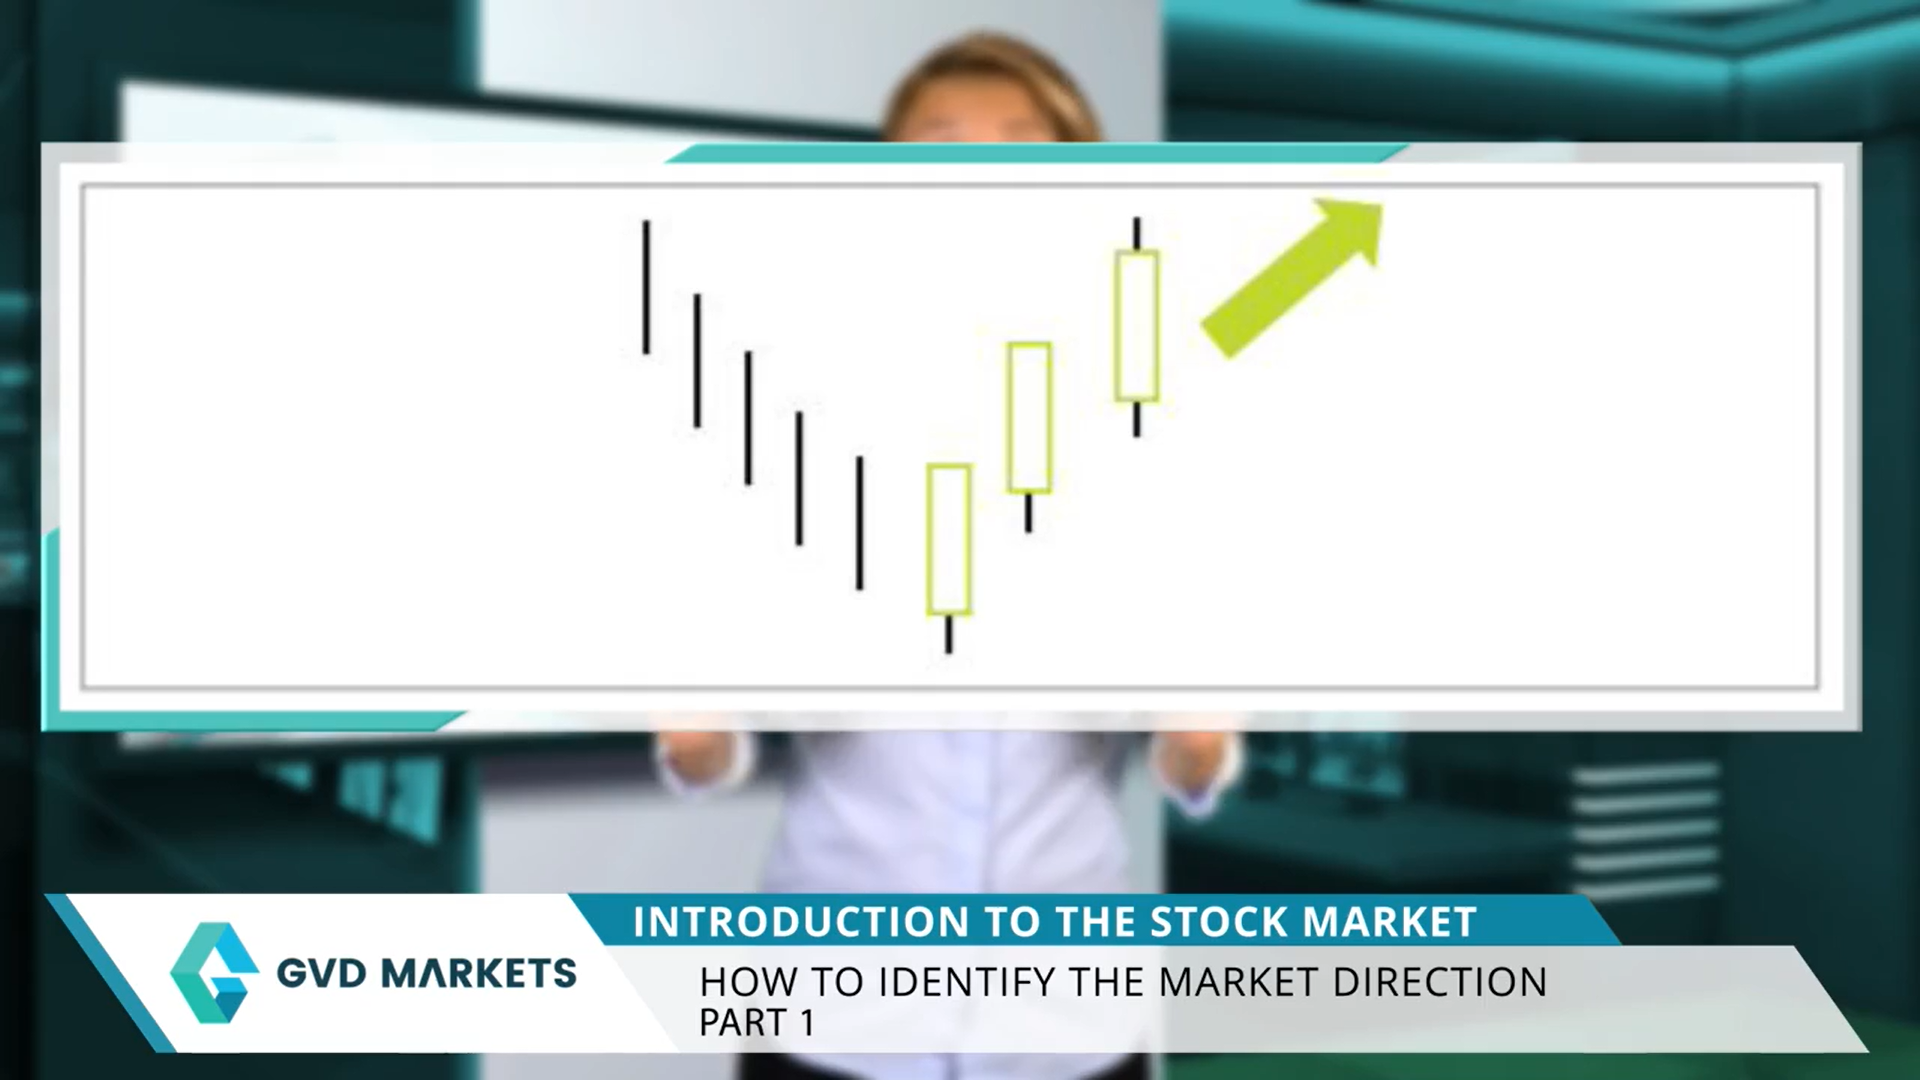
Simply put, a rally is in an upwards move, and a decline is a downwards move. Let’s look at a decline first. In the left part, notice how the next bar always breaks the previous bars low. It also has a lower high. This means the market is in decline mode. Remember that in real market situations it may not happen consecutively, but a general move down is still considered a decline. A rally is just the opposite. Look at the right part of the chart. The market going up has every consecutive bar. Bri, the previous bars high.
It also has a higher low, The market is in rally mode. If the market then goes into decline, mode, then afterwards back to rally mode, the chart will have the shape of a wave. Markets will always move in waves.
They’ll never plunge down or soar unless on erratic days over general long periods of time, markets will always move in waves. And this is very healthy. Now that we’ve understood a rally and a decline, let’s move on to swing highs and swing lows. Simply put, the meeting point of a rally and a consecutive decline Forming the shape of a tent is a swing high.
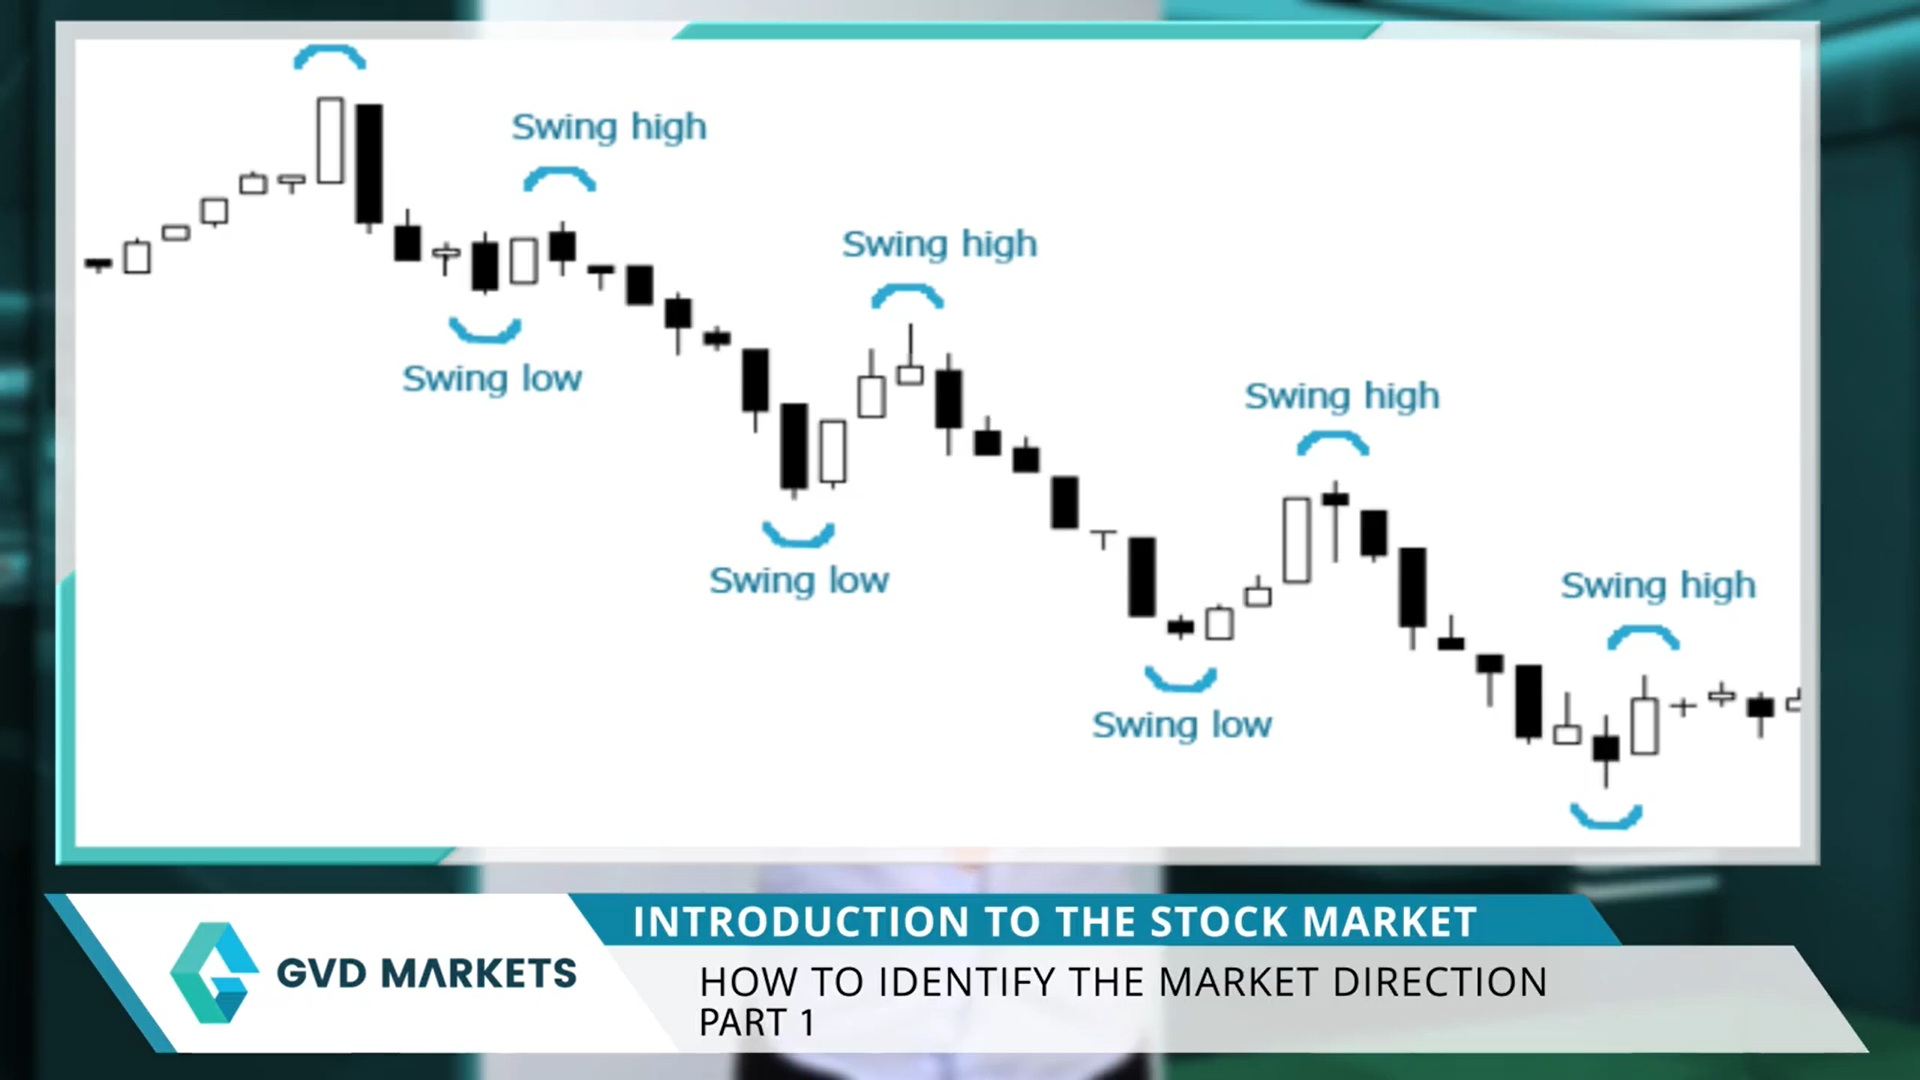
The opposite, the meeting point of a decline and a consecutive rally is a swing low. Trends are made of swing highs and swing lows. People use different names to call them, but they all technically follow this because a swing high is a natural place of resistance.
It basically means that the market rallied, hit a supply point, then either buying diminished or too much selling happened and it fell. The longer a swing high remains untouched, the stronger it gets. Here’s a real example of a chart. It’s basically a downtrend, but it’s full of swing highs and swing lows. We’ve marked both on the chart.
You should learn how to recognize them.
How do trade swings?
Swing trading has been described as a kind of fundamental trading in which positions are held for longer than a single day.
Most fundamentalists are actually swing traders, since changes in corporate fundamentals generally require several days or even a week to cause sufficient price movement to render a reasonable profit. But this description of swing trading is a simplification. In reality, swing trading sits in the middle of the continuum between day trading to trend trading. A day trader will hold a stock anywhere from a few seconds to a few hours, but never more than a day.
A trend trader examines the longterm fundamental trends of a stock or index and may hold the stock for a few weeks or months. Swing traders hold a particular stock for a period of time, generally a few days to two or three weeks, which is between those extremes, and they will trade the stock on the basis of its intraweek or intramonth oscillations between optimism and pessimism.
The right stockcks for swing Trading.
The first key to successful swing trading is picking the right stocks. The best candidates are large cap stocks, which are among the most actively traded stocks on the major exchanges in an active market.
These stocks will swing between broadly defined high and low extremes, and the swing trader will ride the wave in one direction for a couple of days or weeks, only to switch to the opposite side of the trade.
The Right Market
When the stock reverses direction, the right market in either of the two market extremes, the bear market environment or raging bull market swing trading proves to be a rather different challenge than in a market between these two extremes.
In these extremes, even the most active stocks will not exhibit the same up and down oscillations as when indexes are relatively stable for a few weeks or months, and a bear market or bull market momentum will generally carry stocks for a long period of time in one direction only, thereby confirming the best strategy is to trade on the basis of the longer termm directional trend. The swing trader, therefore, is best positioned when markets are going nowhere.
When indexes rise for a couple of days, then decline for the next few days, only to repeat the same general pattern again and again, a couple of months might pass with major stocks and indexes roughly at the same as their original levels.
But the swing trader has had many opportunities to catch the short term movements up and down. Of course, the problem with both swing trading and longterm trend trading, its success is based on correctly identifying what type of market is currently being experienced.
Trend trading would have been the ideal strategy for the bull market of the last half of the 1990s, while swing trading probably would have been best for 2000 and 2001.
Taking Profits
when it comes time to take profits, the swing trader will want to exit the trade as close as possible to the upper or lower channel line without being overly precise, which may cause the risk of missing the best opportunity in a strong market when a stock is exhibiting a strong directional trend, traders can wait for the channel line to be reached before taking their profit, but in a weaker market, they may take their profits before the line is hit in the event that the direction changes and the line does not get hit on that particular swing.
The bottom line swing trading is actually one of the best trading styles for the beginner trader to get his or her feet wet, but it still offers significant profit potential for intermediate and advanced traders.
Swing traders receive sufficient feedback on their trades after a couple of days to keep them motivated, but their long and short positions of several days are of the duration that does not lead to distraction. By contrast, trend trading offers greater profit potential if a trader is able to catch a major market trend of weeks or months, But few are the traders with sufficient discipline to hold a position that long without getting distracted.
On the other hand, trading dozens of stocks per day. Day trading may just prove too white knuckle of a ride. For some, making swing trading the perfect medium between the extremes.
A trader should really be skilled and acknowledged to make profit from the forex market. At GVD Markets, top forex brokers, here we provide live forex prices, forex news, forex profit calculator. If you want to become a top trader of the forex market, visit our GVD Markets Education Academy to learn more about advanced forex trading now! Beyond the basics of support and resistance, mastering these concepts requires practice and real-time application – tools and education like those offered at GVD Markets can bridge the gap between theory and profitable execution.