29 April 2025

China America Strike
analyst, Market Analyst

US-China Trade War Impacts Dollar, Oil, and Stocks

US Dollar and Trade Policy Uncertainty The us dollar slid across the board as investors waited warily for further news of us trade policy and braced for a week packed with economic data, which may initially provide an indication on whether us President Donald Trump’s trade war is hitting home when crude oil prices fell as economic worries from the us China trade war were pressuring demand.  Stock Market Dynamics and Corporate Earnings The us China trade war is dominating investor sentiment in moving oil prices, superseding nuclear talks between the us and Iran and discord within the OPEC Plus coalition. Us stocks turned lower while their European counterparts gained as investors monitored progress in tariff talks at the top. And an eventful week of corporate earnings and economic data.  Tech sector weakness weighed heavily on the SP and Nasdaq. The dollar yen pair plummeted in the last session. The MACD is giving a positive signal. The Bitcoin dollar pair skyrocketed in the last session. The MACD is giving a positive signal. Gold prices skyrocketed in the last session. The Stochastic RSI is in overbought territory. Crude oil prices plummeted in the last session.  Upcoming Economic Data and Trading […]

US-China Trade War Impacts Dollar, Oil, and Stocks Read Post »

Showing swing highs and swing lows or waves in market
Educational Lessons

How to identify the Market direction Pt.2

Technical Analysis We last parted with this image, so market trends are made of swing highs and swing lows or waves. Now wave is a very natural part of the market like we’ve seen before.  Markets will generally move up and down in a gradual fashion over long periods of time when the market is in a downtrend, we get lower swing lows and lower swing hot. Now it’s easy to see on this chart that every swing low was lower than the previous one, and every swing high was lower than the previous one as well.  Likewise, an uptrend has higher swing highs and higher swing lows, so a set of lower swing highs or lows every time means the market is in a downtrend instead of higher swing highs or lows means the market is in an uptrend. Words may confuse you, but if you look at a chart, things get much simpler. Now the question remains, how do we know that the market is changing direction?  There are two things you should look at when the stock is in an uptrend and it breaks the previous swing low. The uptrend is now in question. When this happens, we’re looking to see whether this fall continues or not. We need one more thing. If the market makes a lower swing high and continues downwards, we have the characteristics of a downtrend with an uptrend.  This means almost certainly that the uptrend is now over and the market will now either go sideways or in a full blown downtrend. It works the same with a downtrend when a previous swing high breaks and we get a higher swing low, the market continues upwards.  We can safely assume the downtrend is over and a new uptrend has begun. Now, these are general principles you can use for all markets. Just make sure they’re not spiky or can not be read or have no volume. These will work great on Nasdaq charts. Let’s see the other side of things.  Fundamental Analysis Now, fundamental analysis before we get into why some investors closely track a stock’s likely direction. Let’s look at a few indicators that help them with the task.  While the financial markets have clearly stated business hours, developments outside of those hours continue to influence both the value of securities and investor behaviour, geopolitical events and natural disasters, for example, can occur at any time. Events like the assassination of a sitting president or a major terrorist attack are likely to indicate a lower market. Open corporate data also plays a role.  Earnings announcements made after the close or before the open can influence the market’s direction In January April July and October, the vast majority of firms released their results for the quarter. Good news from a bellwether firm often leads to a higher stock market. Open bad news can have the reverse effect. Other important news comes out before the markets open. A wide variety of economic releases, including employment data, retail sales, and gross domestic product results, are released at eight 30 AM.  Once again, both good news and bad news can sway the market. Open direction trading activity is also a common indicator. Extended hours trading takes place after the financial markets close for the day and before they open, this activity can help investors predict the open market direction. In fact, gauges such as the Nasdaq 100 premarket indicator SM, are designed specifically for this purpose.  The Nasdaq 100 after hours indicator SM is a similar gauge.  International Market Influence When domestic markets are closed for the day, international markets are open and trading a good day in Asian markets can suggest the us markets will open higher. Devastating losses overseas can lead to a lower open at home by paying attention to developments overseas, Domestic investors can get an idea about what direction they expect local markets to move when they open for the day.  Major stock exchanges in Tokyo, Germany and London are often used as barometers for what will happen in the us. The futures market is yet another barometer used to predict the direction financial markets will move. Unlike the stock market futures markets never close. Futures contracts trade based on the values of the stock market benchmark indexes. They represent SP 500 futures trade based on the value of the standard Pause 500 just as the Dow futures trade based on the value of the Dow Jones Industrial average. Since the securities in each of the benchmark indexes represent a specific market segment, knowing the direction of pricing on futures contracts for those indexes can be used to project the direction of prices on the actual securities and the markets in which they trade. If SP futures are trending downward all morning, it’s likely that stock prices in the us exchanges will move lower when trading opens for the day.  Once again, the opposite is also true, with rising futures prices suggesting a higher open, serious market watchers wake up early, pull the data and use these various indicators singly and in combination to discern the direction of the opening moves. In the us market, less ambitious investors just tune into the morning financial news broadcasts and let the talking heads provide an update on expectations for the day.  Either way, it is possible to get a fairly solid reading on what to expect when us trading starts for the day.

How to identify the Market direction Pt.2 Read Post »

Educational Lessons

How To Identify The Market Direction?

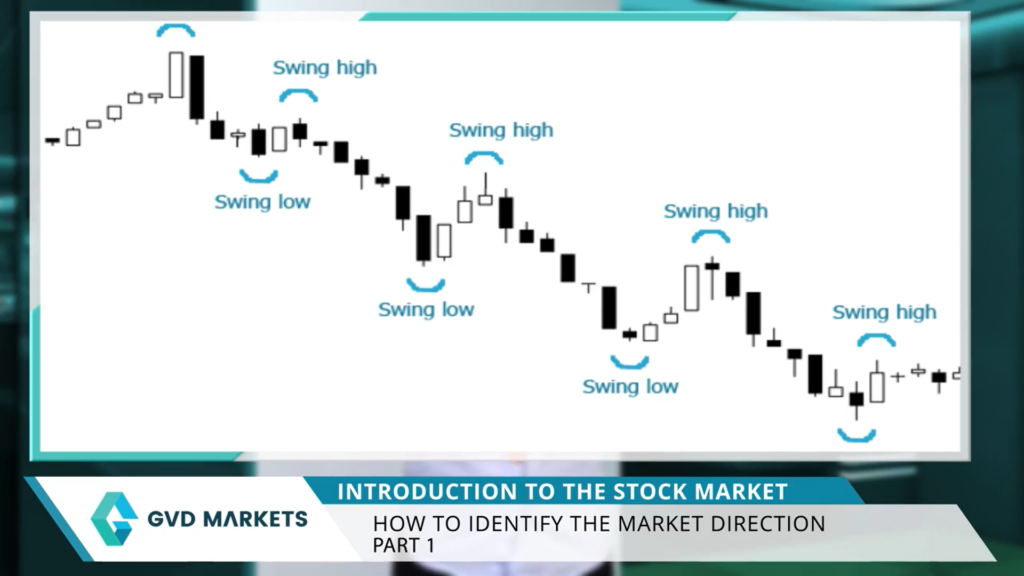
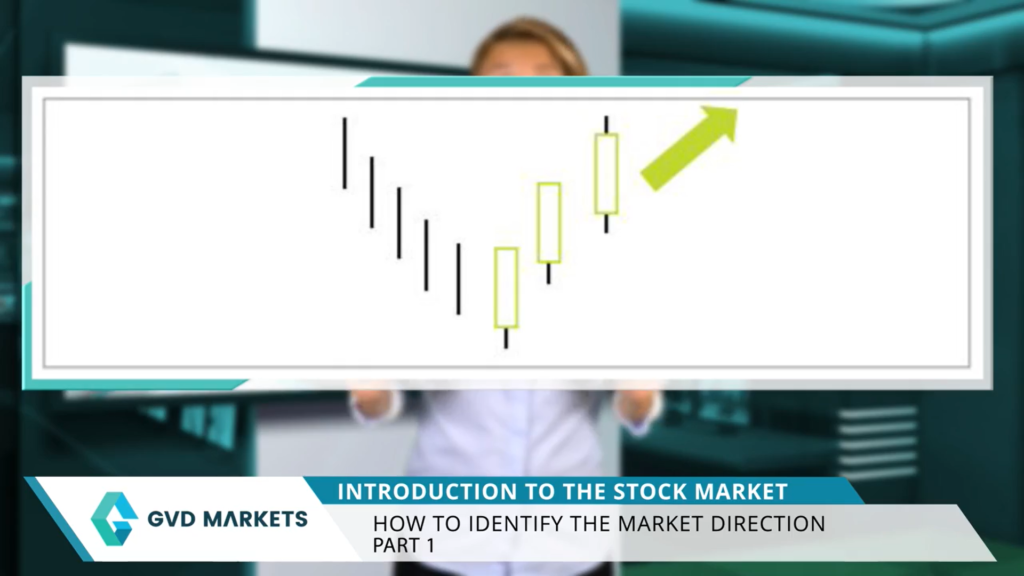
How to identify the market direction? The theory today we’re going to learn about market direction. It’s very interesting because everyone keeps coming up with the question, will the market rise or fall using just a few technical tools, not indicators, just pure price action?  We can actually determine market direction. Market direction is actually referred to in the technical world as trends. A stock moving upwards is in an uptrend. A stock moving downwards is in a downtrend. Sometimes stocks reach a no trade zone or a sideway zone. This happens because when markets go up, it forces a situation of supply.  And when markets fall down, it forces a situation of demand. When we use the concepts of supply and demand over very long periods of time. You must realize that psychology exists on all time frames, except of course, in tick charts where you have volume, markets will always move the same way.  If your concept is technically sound, let’s see how you can become your own amateur financial analyst, Determining whether the stock you’re stuck in or making a profit with might continue to go up or continue to move down. The first thing we’re going to learn is rally and decline. Rallies and declines are seen on a per bar basis, meaning we look only at one bar and the next.  Simply put, a rally is in an upwards move, and a decline is a downwards move. Let’s look at a decline first. In the left part, notice how the next bar always breaks the previous bars low. It also has a lower high. This means the market is in decline mode. Remember that in real market situations it may not happen consecutively, but a general move down is still considered a decline. A rally is just the opposite. Look at the right part of the chart. The market going up has every consecutive bar. Bri, the previous bars high.  It also has a higher low, The market is in rally mode. If the market then goes into decline, mode, then afterwards back to rally mode, the chart will have the shape of a wave. Markets will always move in waves.  They’ll never plunge down or soar unless on erratic days over general long periods of time, markets will always move in waves. And this is very healthy. Now that we’ve understood a rally and a decline, let’s move on to swing highs and swing lows. Simply put, the meeting point of a rally and a consecutive decline Forming the shape of a tent is a swing high.  The opposite, the meeting point of a decline and a consecutive rally is a swing low. Trends are made of swing highs and swing lows. People use different names to call them, but they all technically follow this because a swing high is a natural place of resistance.  It basically means that the market rallied, hit a supply point, then either buying diminished or too much selling happened and it fell. The longer a swing high remains untouched, the stronger it gets. Here’s a real example of a chart. It’s basically a downtrend, but it’s full of swing highs and swing lows. We’ve marked both on the chart.  You should learn how to recognize them.  How do trade swings?  Swing trading has been described as a kind of fundamental trading in which positions are held for longer than a single day.  Most fundamentalists are actually swing traders, since changes in corporate fundamentals generally require several days or even a week to cause sufficient price movement to render a reasonable profit. But this description of swing trading is a simplification. In reality, swing trading sits in the middle of the continuum between day trading to trend trading. A day trader will hold a stock anywhere from a few seconds to a few hours, but never more than a day.  A trend trader examines the longterm fundamental trends of a stock or index and may hold the stock for a few weeks or months. Swing traders hold a particular stock for a period of time, generally a few days to two or three weeks, which is between those extremes, and they will trade the stock on the basis of its intraweek or intramonth oscillations between optimism and pessimism.  The right stockcks for swing Trading. The first key to successful swing trading is picking the right stocks. The best candidates are large cap stocks, which are among the most actively traded stocks on the major exchanges in an active market.  These stocks will swing between broadly defined high and low extremes, and the swing trader will ride the wave in one direction for a couple of days or weeks, only to switch to the opposite side of the trade.  The Right Market

How To Identify The Market Direction? Read Post »

Scroll to Top